


Warehousing SLAs: The Metrics That Actually Predict On-Time Delivery
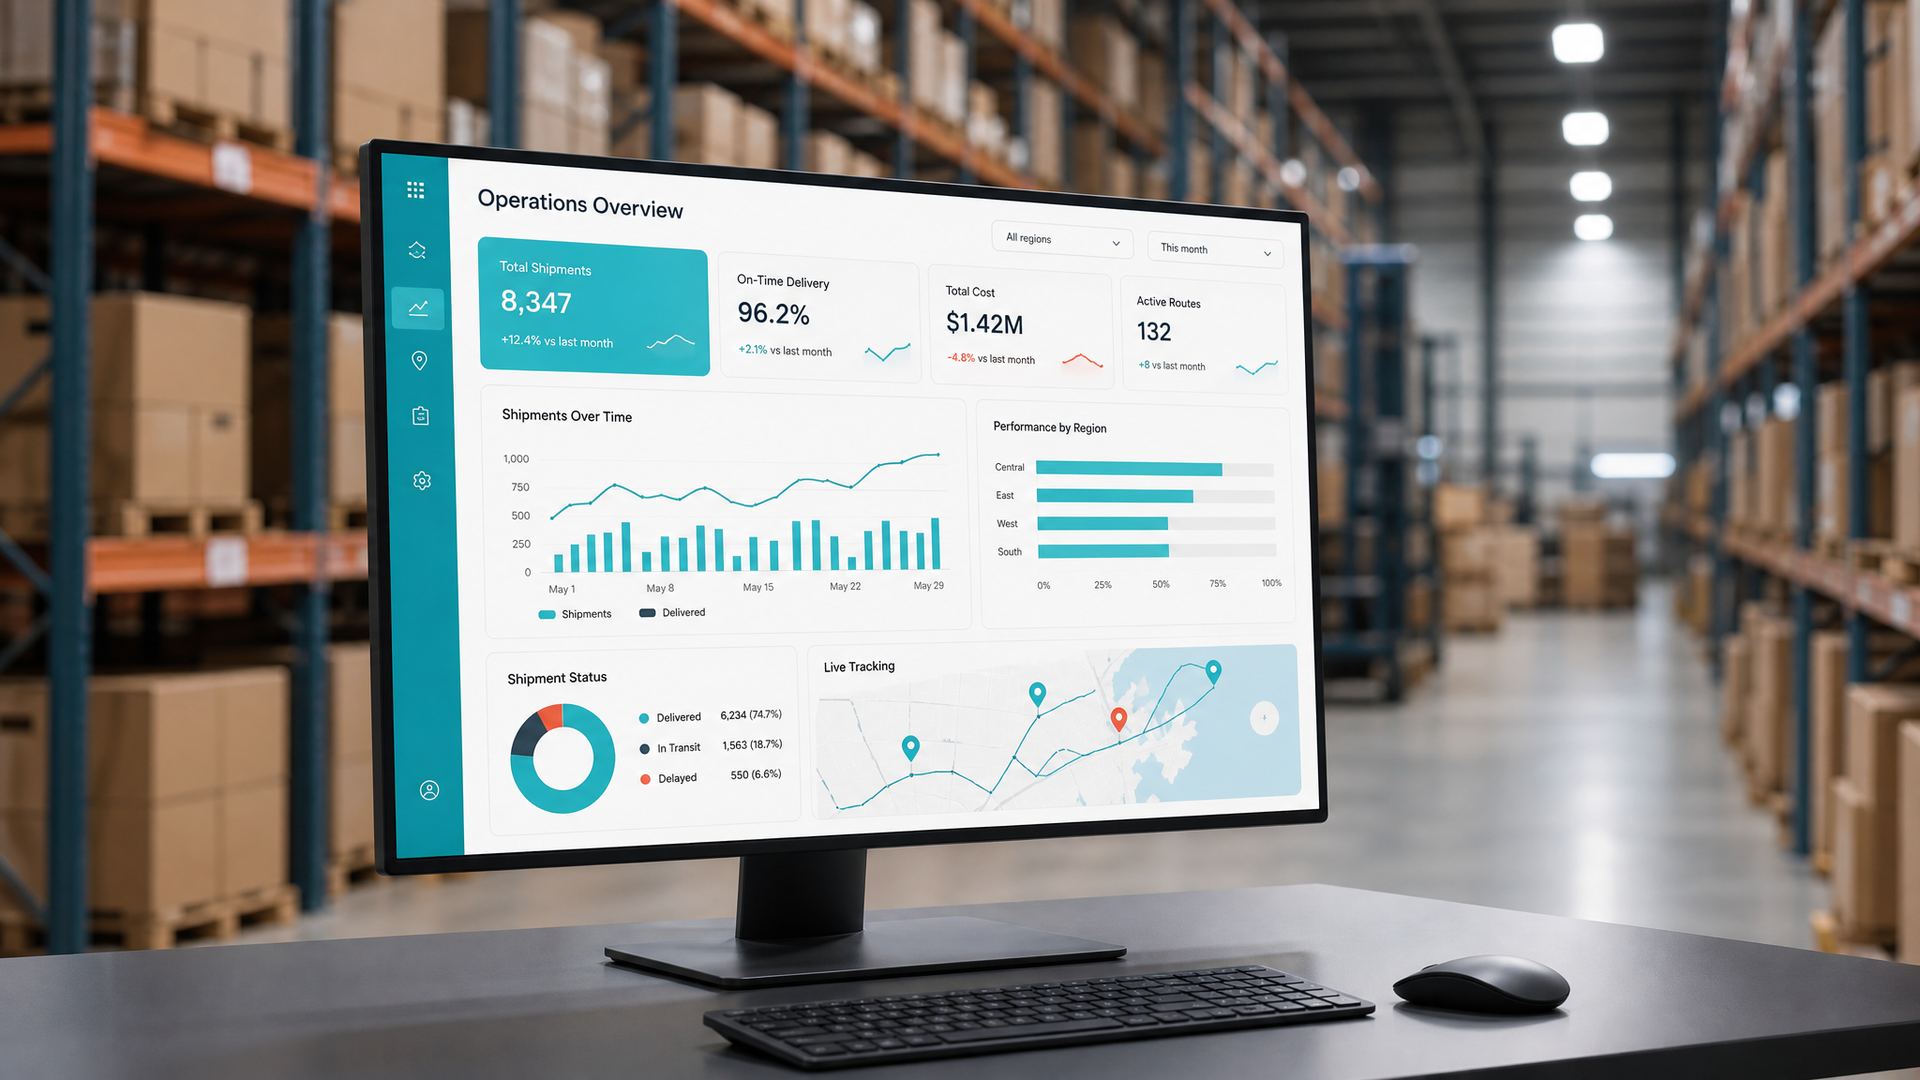
Every 3PL warehousing contract in Australia has an SLA. Most of the SLAs are broadly similar on paper. Very few of them predict actual operational performance.
Brands that have been through a warehousing supplier change usually learn this the hard way. The metrics that got tracked in the previous relationship were not the metrics that would have surfaced the problems earlier. The issue was always visible in the operational data, but not in the headline SLA.
Here is what the useful metrics actually look like, why the standard SLA metrics often hide problems, and what to measure if you want warehousing performance to be predictable.
What most warehousing SLAs measure
Most standard warehousing SLAs measure a small set of headline metrics.
On time in full. The percentage of orders picked, packed and dispatched by the promised time. Usually reported at 95 to 99 per cent.
Order accuracy. The percentage of orders picked without error. Usually reported at 99 per cent or higher.
Inventory accuracy. The percentage variance between reported and actual stock levels.
Dock to stock time. How long it takes for incoming stock to become available for picking.
These metrics matter. But when they are reported at high headline percentages across every 3PL, they stop being useful as differentiators. The variance between a good 3PL and a mediocre one shows up in the underlying operational metrics that produce those headline numbers.
The metrics that actually predict performance
Six metrics under the headline numbers predict operational quality far better than the headlines themselves.
Same-day cut-off compliance. The percentage of orders received before the stated cut-off that were actually dispatched that day. A stated 3pm cut-off honoured at 85 per cent is worse than a stated 2pm cut-off honoured at 99 per cent. Ask for the split.
Cut-off compliance by weekday. Warehousing performance is not consistent across the week. Some 3PLs hit their cut-off Monday to Thursday and slip Fridays. Others slip in the two weeks before Christmas. Ask for the daily distribution.
Error rate by cause. Order errors have causes. Wrong item picked. Wrong quantity. Wrong address. Damaged in dispatch. The breakdown by cause tells you where the operational risk actually sits.
Return processing time. How long returned stock takes to be processed and made available for onward pick. A slow return process ties up working capital and increases the effective stock investment.
Peak volume compliance. Warehousing SLAs are easy to hit at normal volume. They break in peak periods. The question that matters is whether the SLA is held at 200 per cent of average volume, not at average volume.
Damaged in dispatch rate. The proportion of orders that arrive damaged at the customer. This is a picking and packing quality metric, not a carrier metric.
Where 3PL SLAs typically hide problems
Three patterns show up.
Reporting on the average rather than the tail. An SLA reported as an aggregate hides the distribution. Ninety-eight per cent on time overall might include a subset of order types running at 85 per cent. The subset matters.
Excluding categories that would fail the SLA. Some SLAs are calculated only on standard orders, excluding rush, oversize or complex kitting. The excluded categories are often the ones with the operational risk.
Reporting monthly averages. A monthly average hides weekly and daily variation. If a 3PL's SLA slips every Friday, a monthly average makes it look consistent.
What to ask in evaluation
Three questions surface the reality.
Can I see your daily on-time-in-full by carrier for the last 90 days?
Can I see your error rate by cause for the last quarter?
What is your peak-volume performance record, and what volume did you handle?
A capable 3PL can produce this in operational review meetings without hesitation. A 3PL who cannot produce this is either not tracking the data or is tracking it and not sharing.
The integration angle
Warehousing SLAs are further improved when the warehousing operation sits inside the same facility as related capability. Print production, mailhouse and packaging under the same roof as 3PL fulfilment removes the freight and coordination overhead that stretches order cycle times.
Same-facility operations typically outperform multi-vendor operations on cut-off compliance, launch speed and error rate, because there are fewer handoffs between production and dispatch.
The takeaway
Warehousing SLAs are only as useful as the metrics behind them. The suppliers who track and share operational depth are the ones whose SLAs actually predict on-time performance. The suppliers who report headline aggregates are the ones whose SLAs surprise you when performance slips.
Reacon operates warehousing, kitting, pick and pack from our NSW facility, integrated with print production and mailhouse. Same-day dispatch cut-off at 3pm, national coverage, operational reporting shared at defined intervals.